How to Identify and Correct Batch Effects
- 21st February 2025
- Posted by: Breige McBride
- Category: Uncategorised

High-throughput biological studies are sensitive to variations in experimental conditions. Batch effects are systematic, non-biological variations often introduced during -omics data generation by technical factors such as sample preparation, reagents, instrumentation, or sequencing runs across sample batches.
Unaddressed batch effects can obscure true biological variation, inflate false discovery rates, and compromise statistical power, leading to misleading conclusions and reduced reproducibility. Therefore, identifying and mitigating batch effects is crucial for reliable data interpretation.
Exploring and visualising data is key to identifying batch effects
Exploratory data analysis can reveal patterns in data that align with known or hidden batch effects, indicating technical rather than biological variation.
Dimensionality reduction methods such as principal component analysis (PCA) and multidimensional scaling (MDS) are commonly used for this purpose. By plotting samples on these reduced dimensions while annotating by known experimental variables, clusters of samples that may be driven by batch effects rather than biological variables can be identified.
Similarly, hierarchical clustering methods group samples based on similarity measures such as between-sample correlation or Euclidean distance. These methods can be used to construct heatmaps or dendrograms which visually represent sample relationships and can reveal batch-driven clusters or branches.
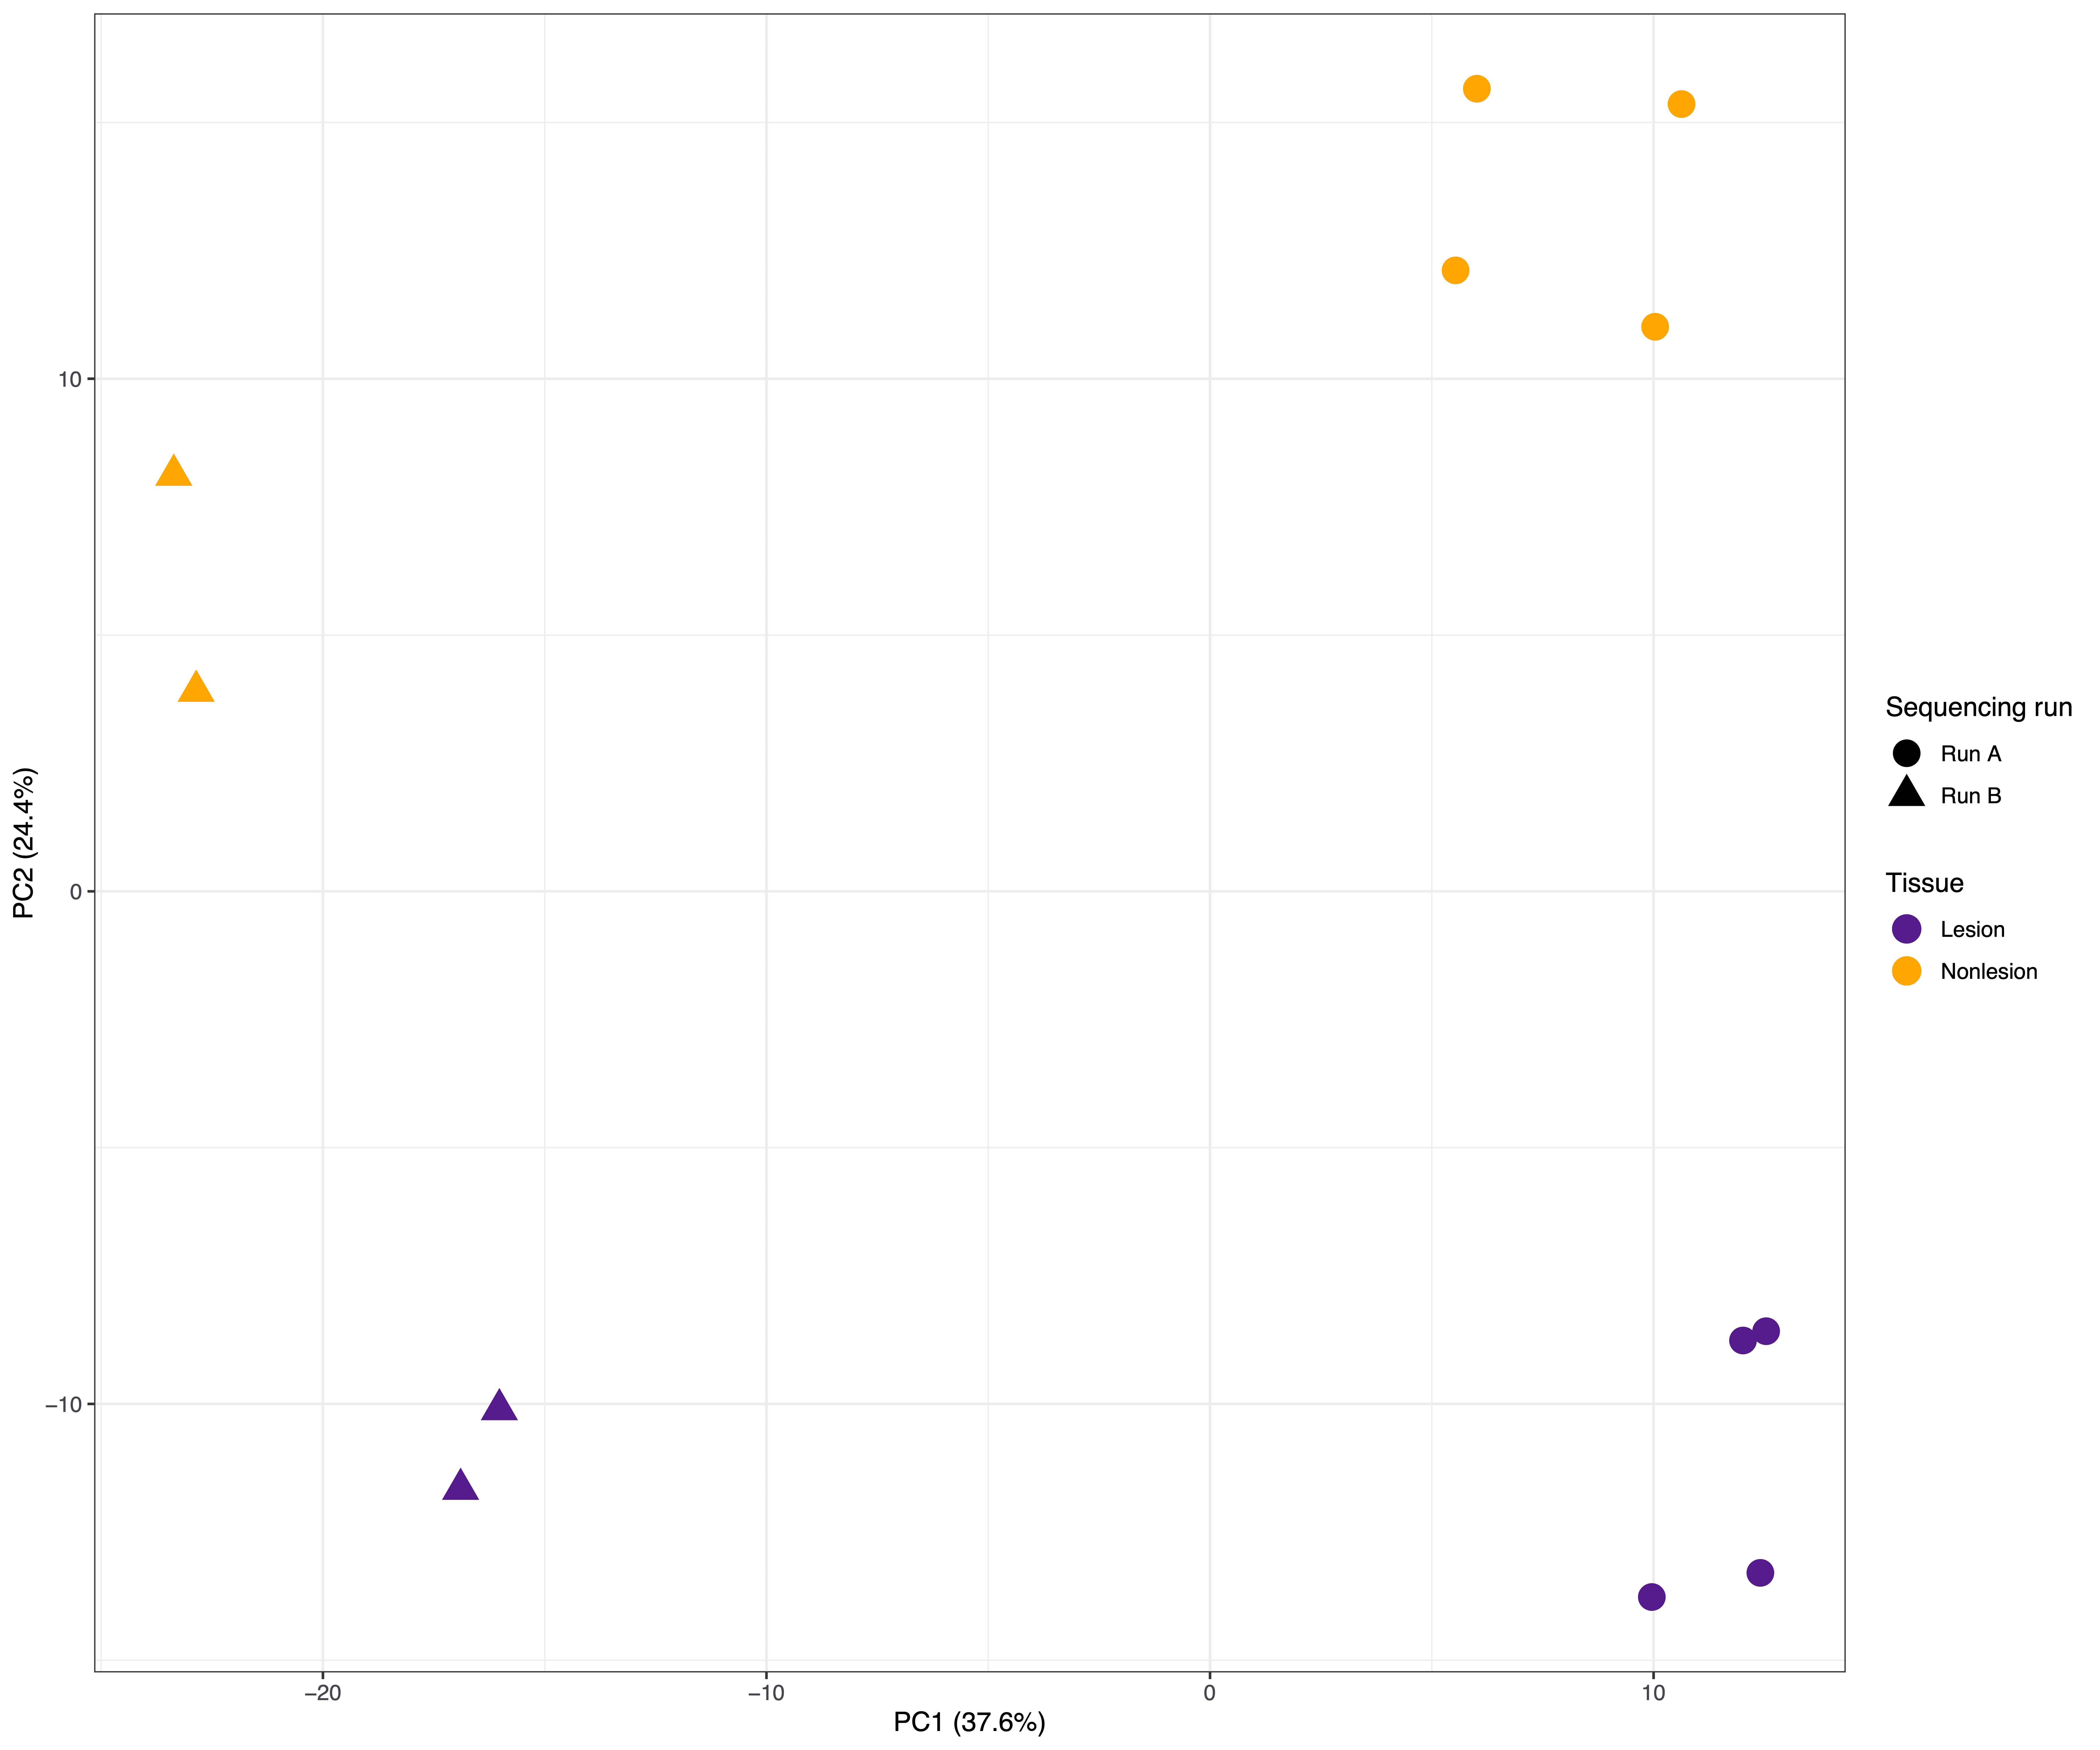
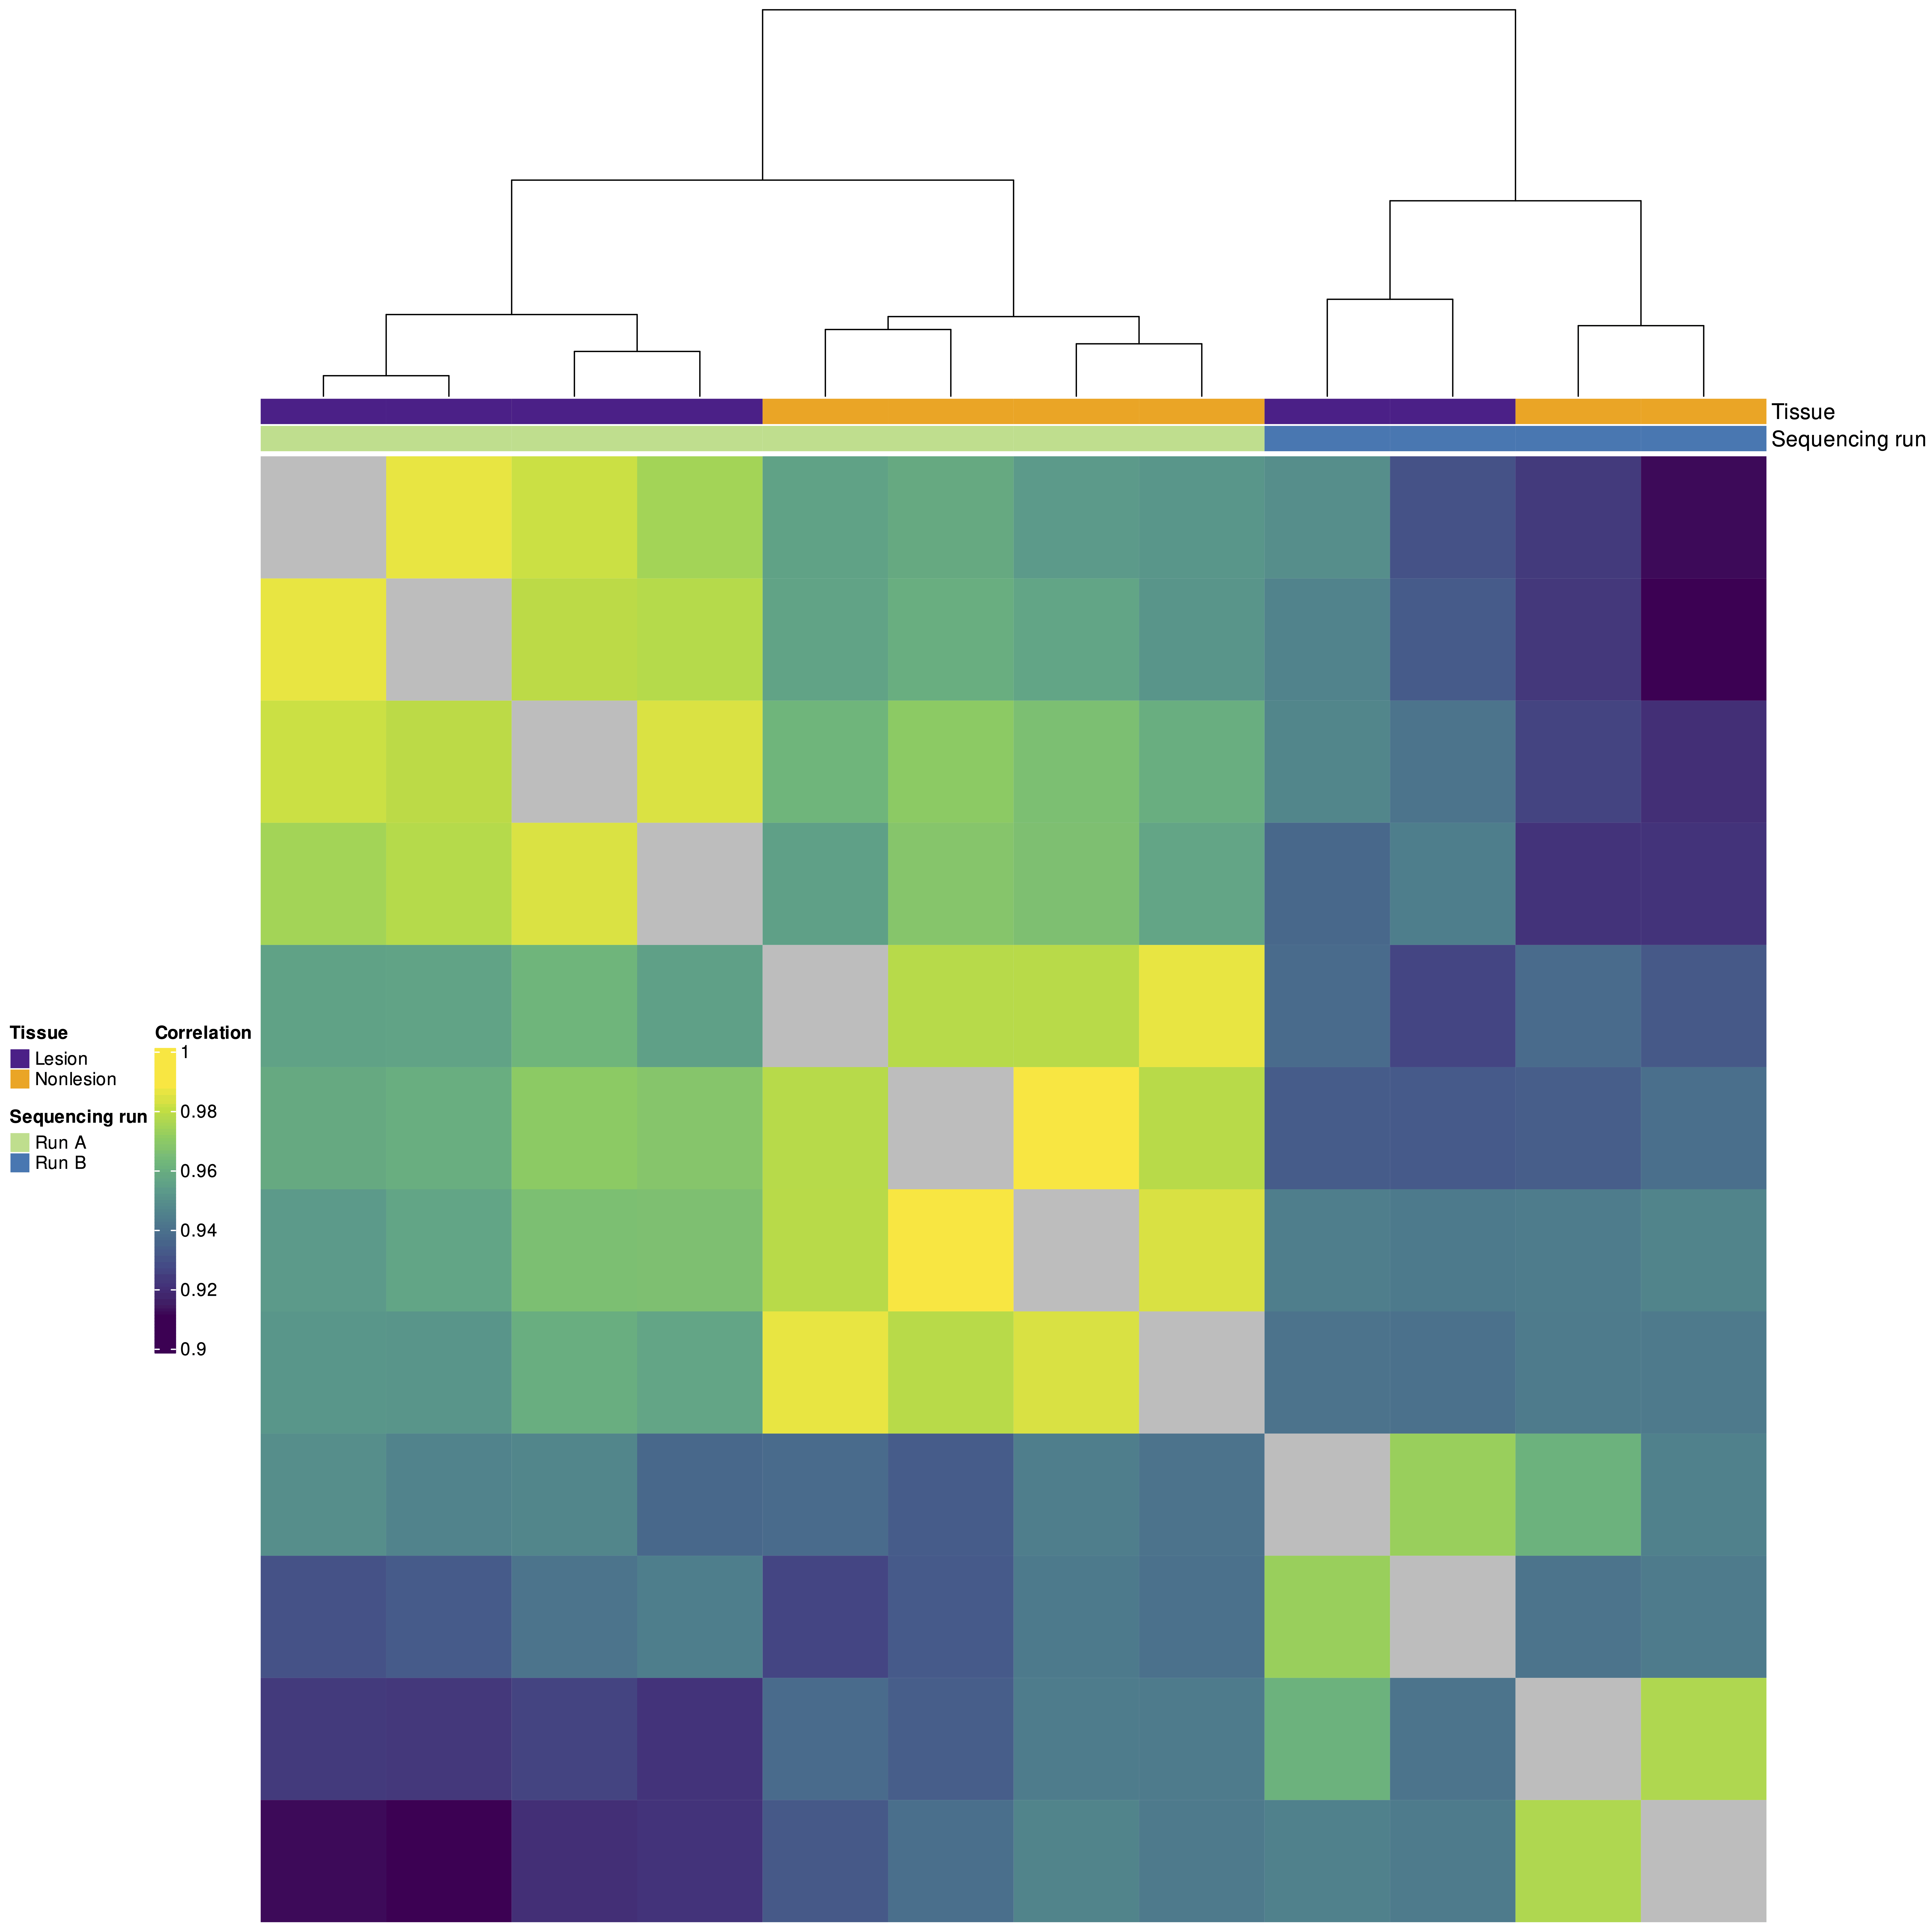
The following example highlights the impact of batch effects on sample clustering. Six RNA-sequencing samples from tumour tissue (Lesion) and six from non-tumour tissue (Nonlesion) were generated to study transcriptional changes at the primary tumour site. Initially, eight samples were processed in sequencing run A, with the remaining samples processed later in run B. PCA and clustering analyses revealed distinct clusters by sequencing run, with clustering by tissue type only observable within each run, indicating that batch effects arising from differences between the two sequencing runs predominated over biological variation.
Batch effect correction using computational methods
There are two main strategies to address batch effects.
The first approach involves removing batch effects directly from the data and using the batch-corrected data in downstream analysis. ComBat is a widely used algorithm for adjusting data for known batch effects while preserving biological signal. ComBat uses an empirical Bayes approach which assumes that systematic batch biases affect many features similarly and leverages shared information to adjust for batch effects by shrinking batch-specific mean and variance toward a global estimate. When the source of batch effects is unknown, or technical information is incomplete or unavailable, surrogate variable analysis (SVA) can be used to identify latent sources of variability that correlate with the technical noise, and estimate surrogate variables for this variation which can then be removed from the data. The number of surrogate variables can either be specified directly by the user or determined automatically through a permutation-based procedure, providing flexibility to adapt to different scenarios.
To successfully apply batch correction, it is essential to consider the nature of the data. For example, ComBat assumes a Gaussian distribution, making it unsuitable for RNA-sequencing count data. In such cases, ComBat-seq, an extension of the original method, should be used instead, as it relies on negative binomial regression to properly model count-based distributions. For other data types, filtering and normalization are typically required before applying ComBat to meet its Gaussian assumption.
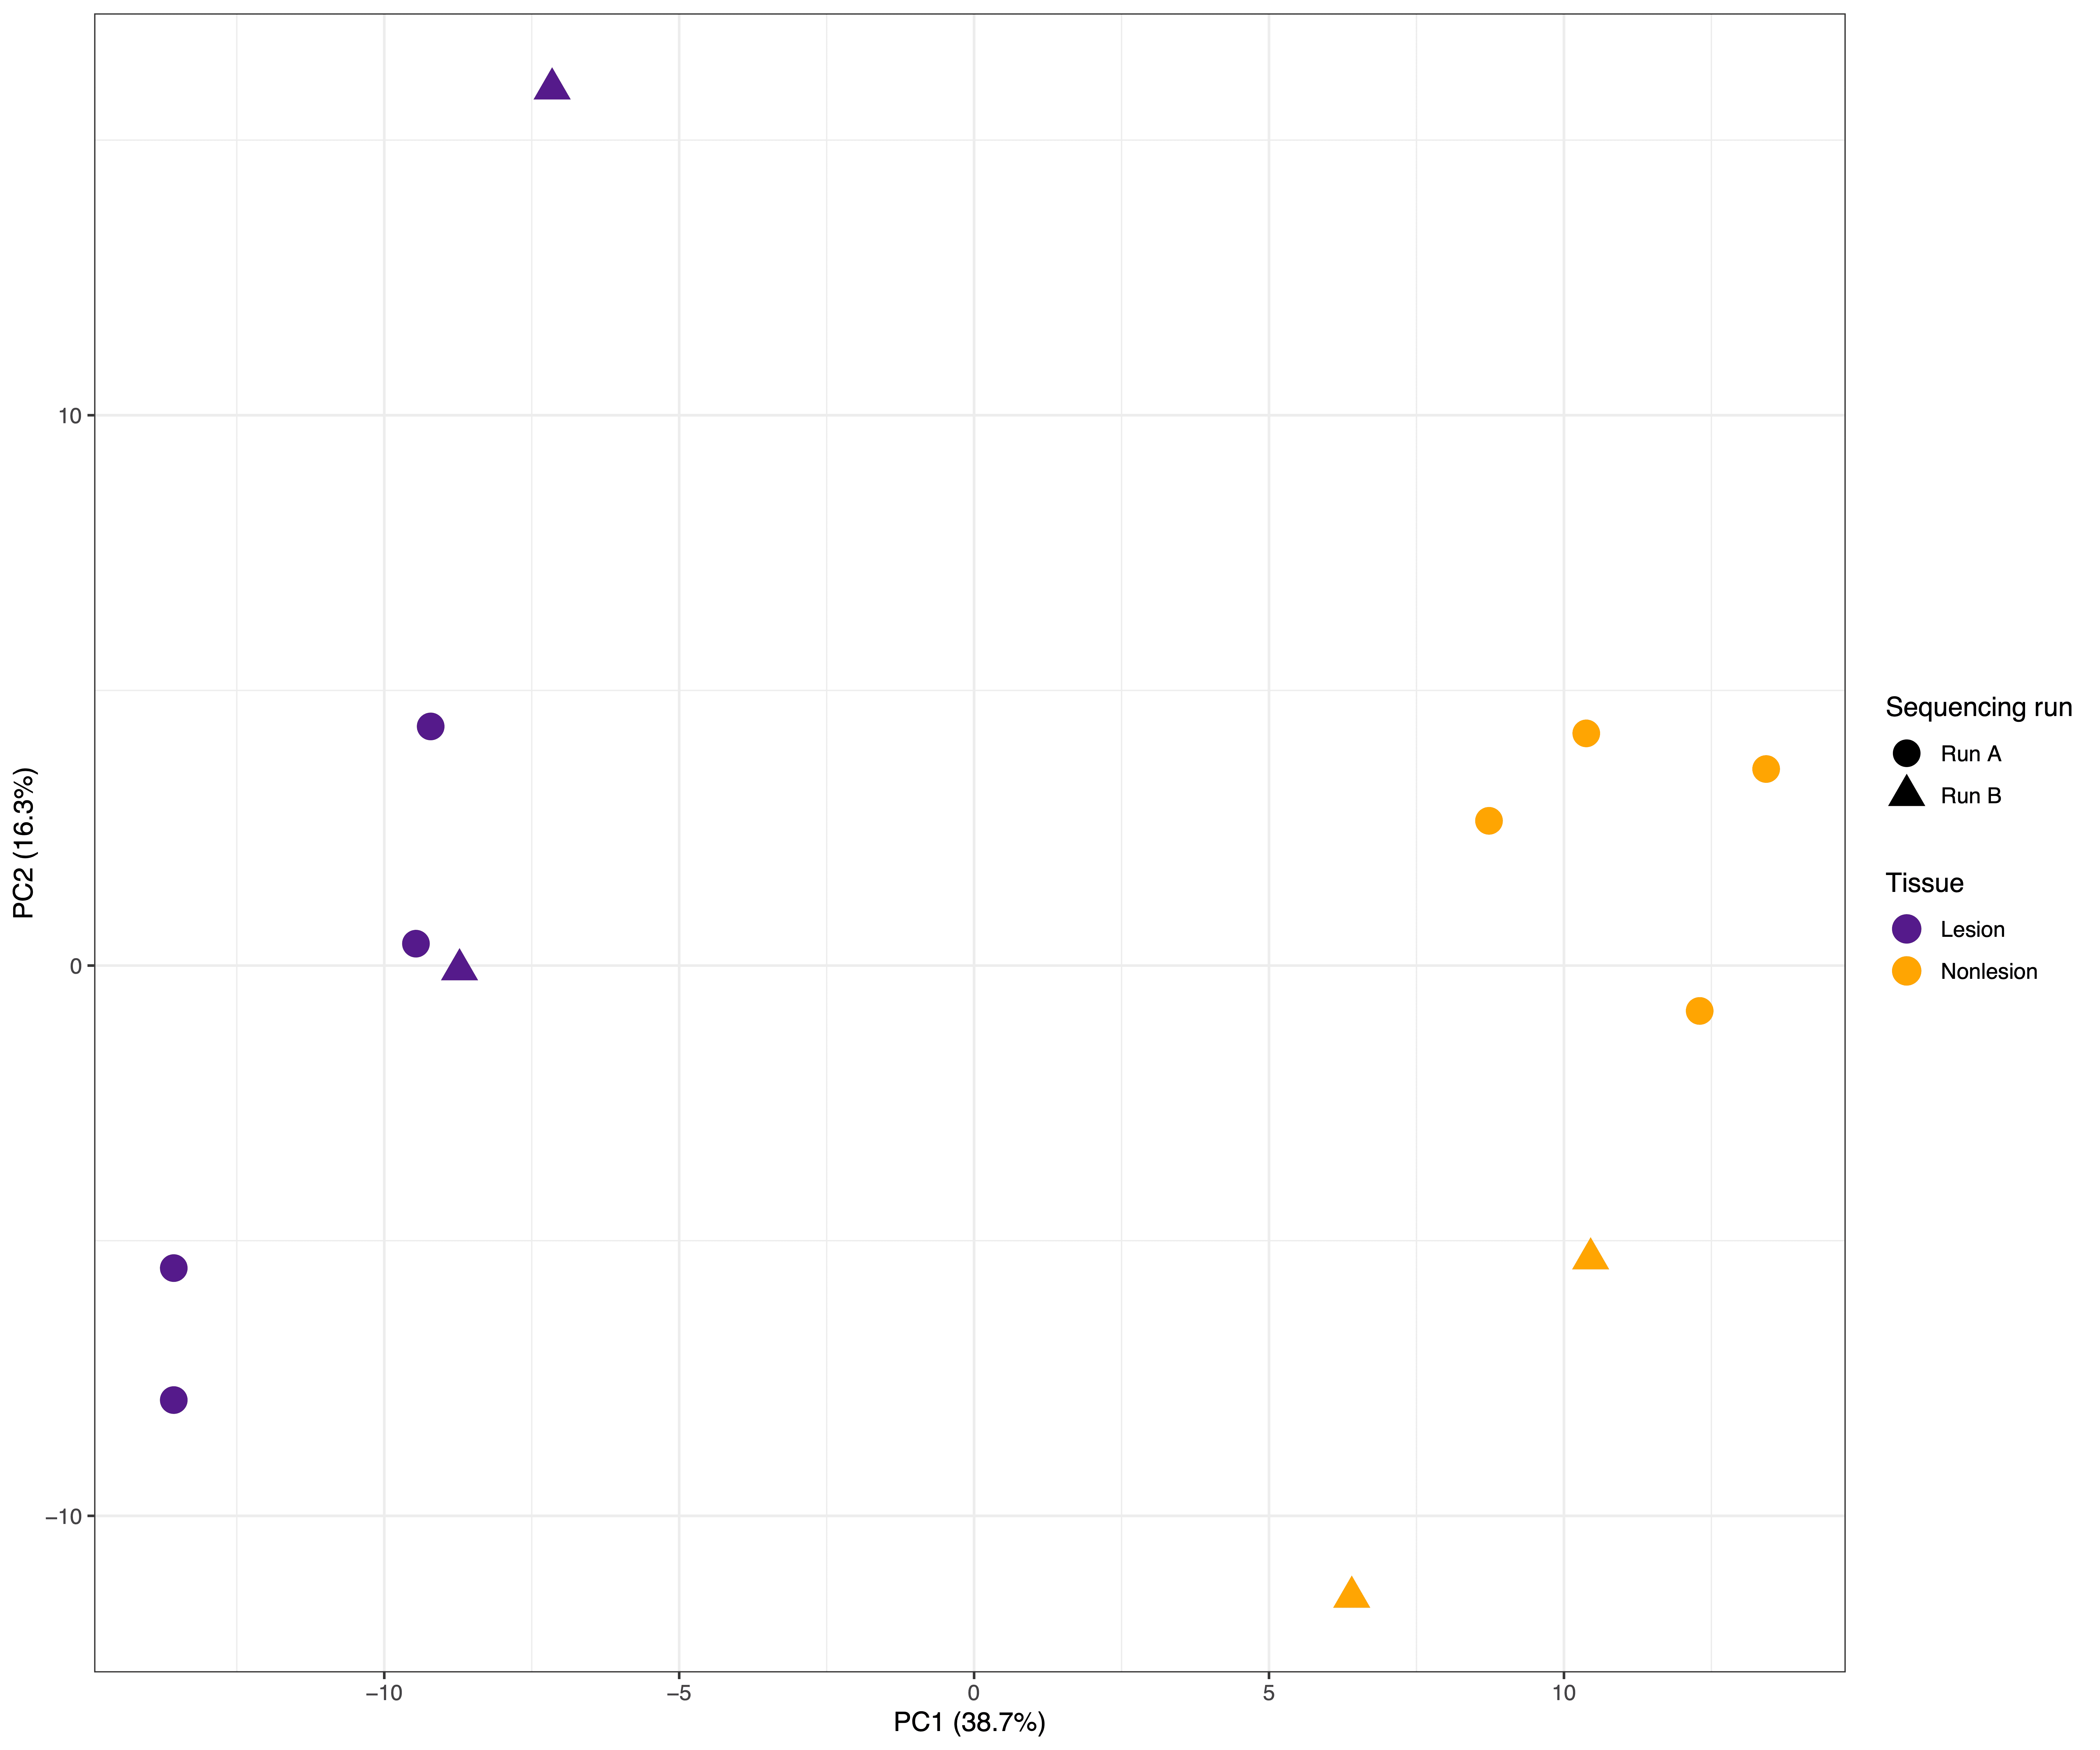
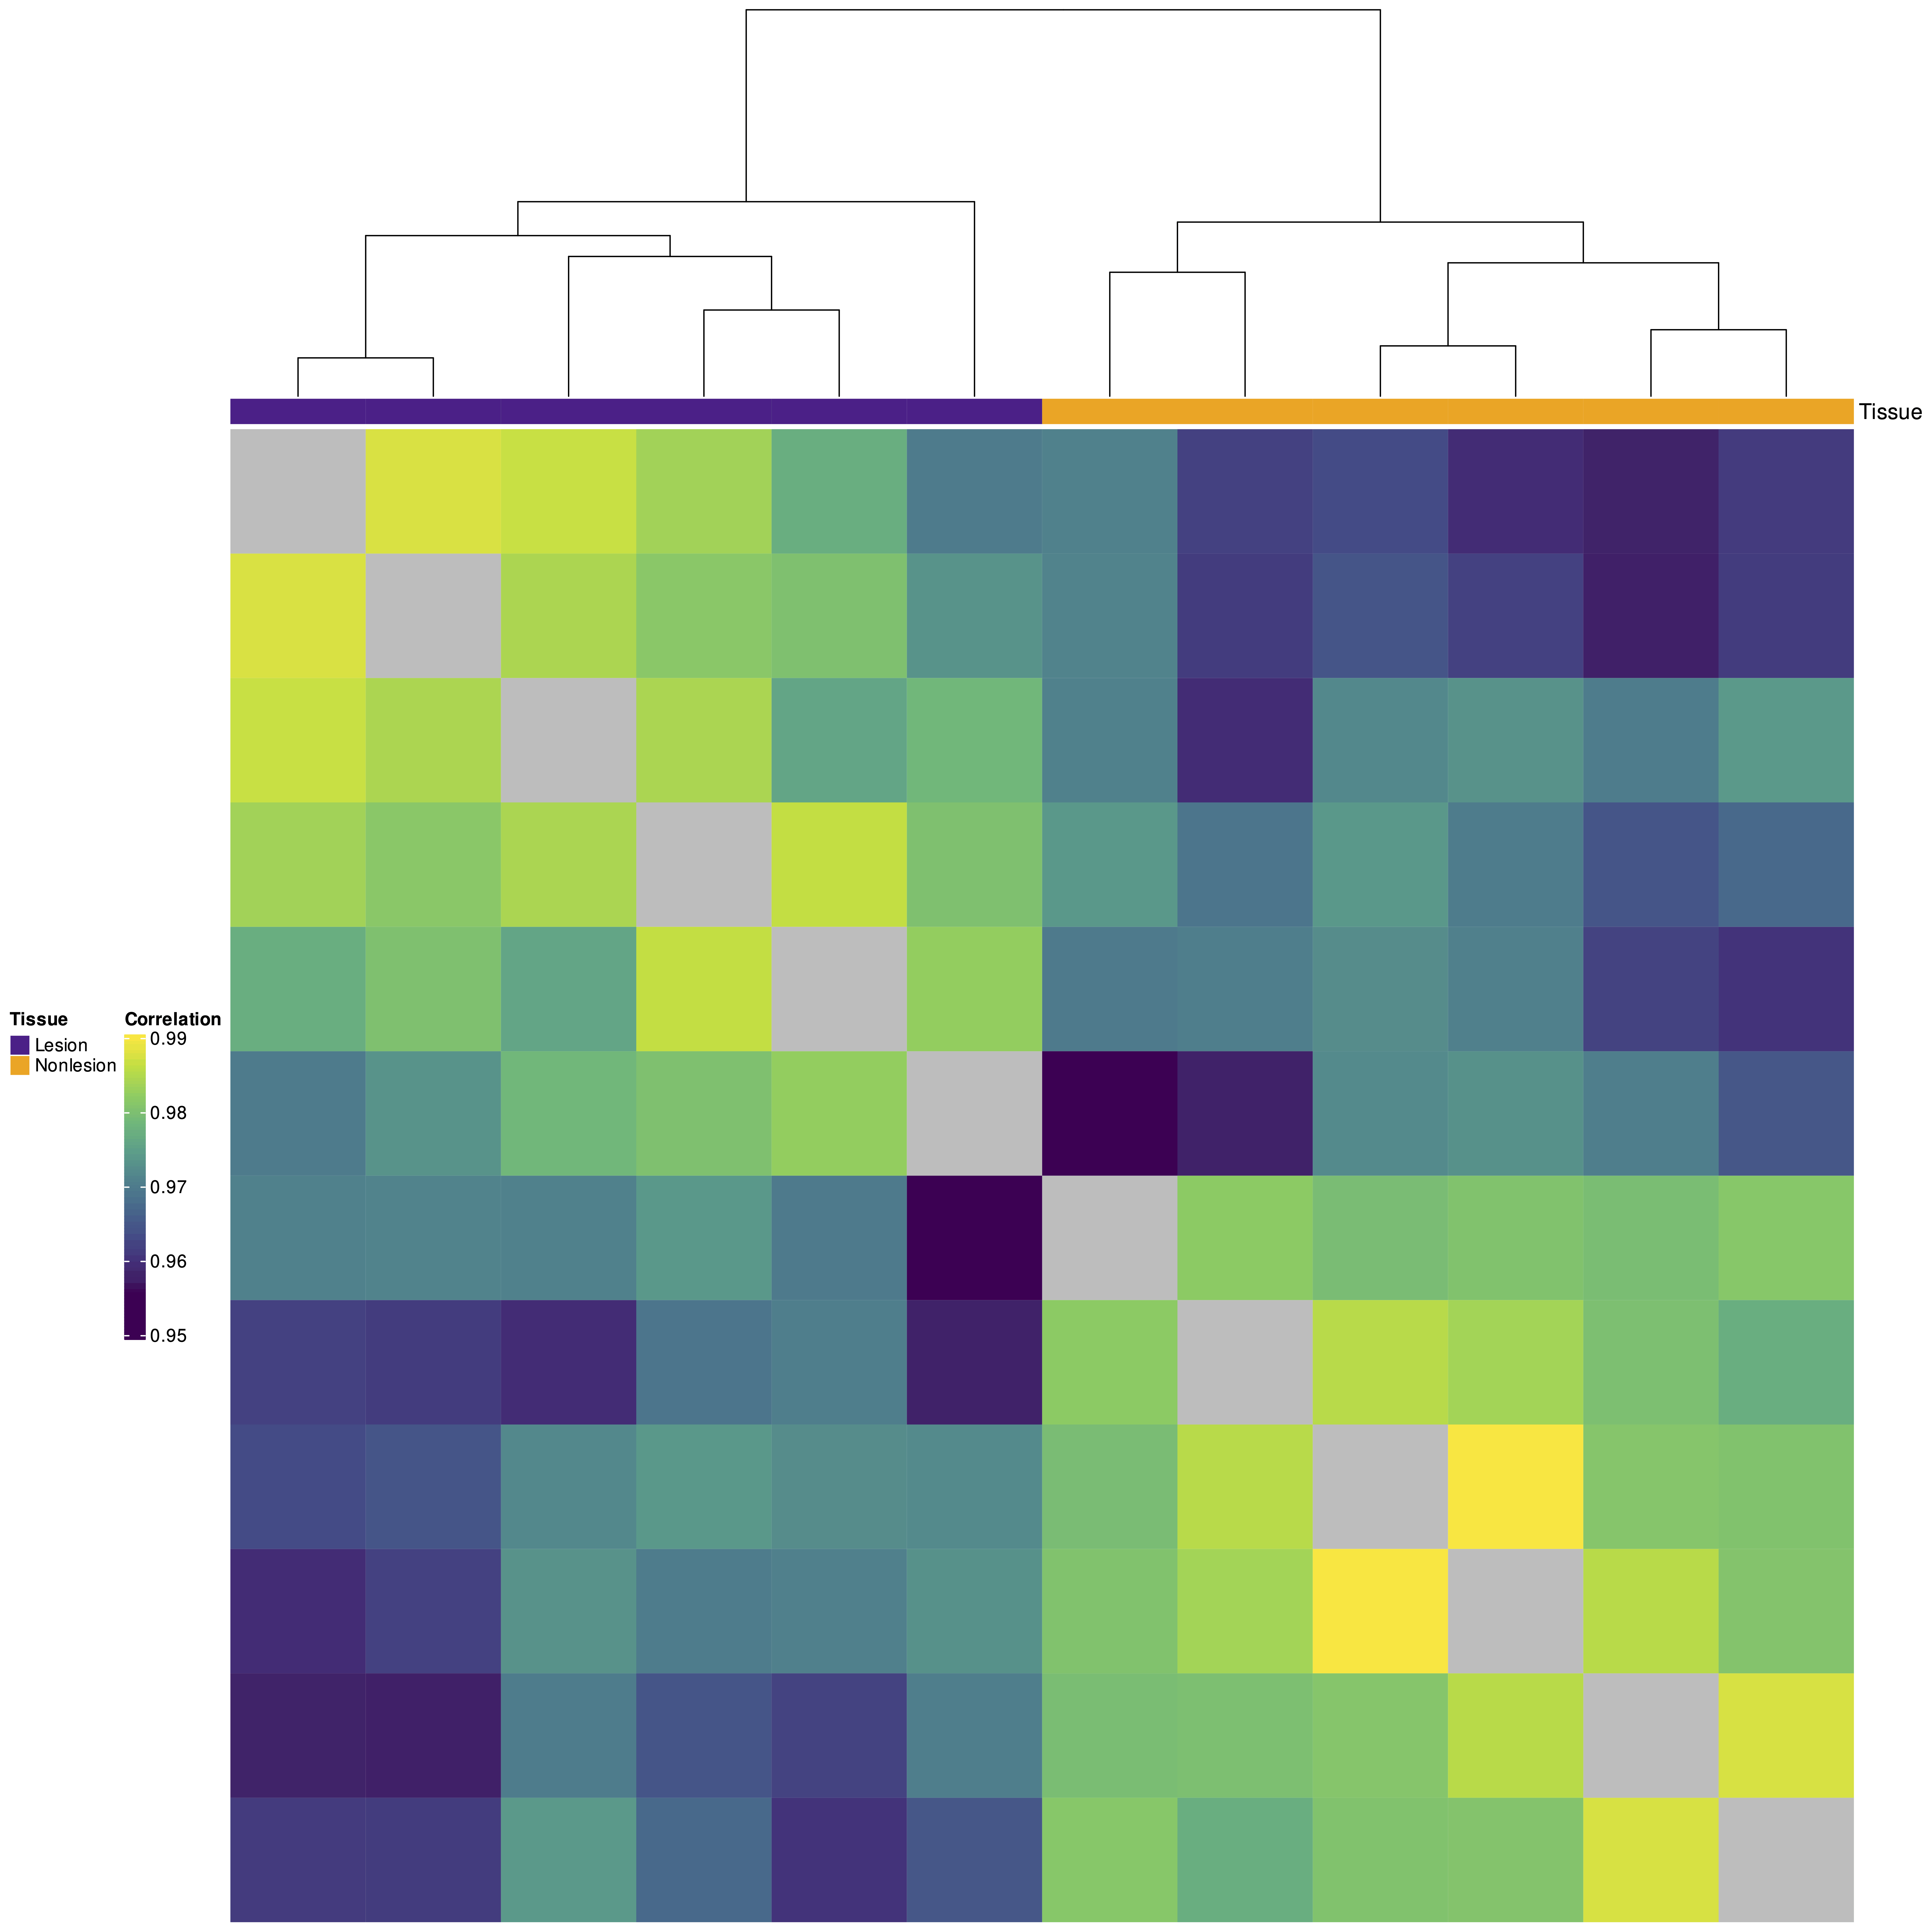
The following plots show the outcome of PCA and clustering analyses after applying ComBat-seq correction to the tumour data set described above. The removal of sequencing run-related variability revealed distinct transcriptional profiles between tumour and non-tumour tissues.
Figures 3 and 4 below show a PCA plot (Figure 3) and correlation heatmap (Figure 4) after correcting for sequencing run with ComBat-seq.
Alternatively, batch effects or surrogate variables can be explicitly modelled in statistical analysis without altering the data. Linear or generalised models can incorporate known batch sources as covariates to account for their contribution to data variance, and interaction terms can further capture condition-specific batch effects (e.g., expression ~ batch + condition + batch:condition). The limma R package is a widely used tool for implementing these models in -omics analyses, providing a framework to conduct hypothesis testing while controlling for batch effects.
The choice of approach depends on the analysis goal. While directly removing batch effects from the data is often useful for visualisation and data exploration, it can also lead to over-correction and loss of valuable information. Modelling batch effects is more appropriate for formal downstream analysis, as it preserves the original data and provides more accurate and interpretable estimates of other effects, particularly in more complex statistical designs.
Rigorous experimental design is essential to avoid batch effect confounding with biological signals
Although these methods can be effective, a critical challenge arises when batch effects are confounded with biological variables. For example, if all samples from one condition are processed in a single batch, technical variations are intertwined with actual biological differences, making it impossible to disentangle between the two. In such cases, the correction method will attribute observed differences between conditions to batch effects, leading to the removal of meaningful biological information and, in extreme cases, rendering the experiment uninterpretable.
Therefore, rigorous experimental design is crucial to prevent batch effect confounding. Batch-to-condition correlations can be minimised by randomising samples and ensuring balanced representation of experimental conditions across all batches. Including technical replicates across batches further enables the assessment and mitigation of variability. By combining these best practices with thorough data exploration and computational correction, researchers can greatly reduce the influence of batch effects and ensure the reliability of their results.
About the author
Dr Andrés G. de la Filia is a Bioinformatics Team Leader. He holds a PhD in Evolutionary Biology from the University of Edinburgh. Andrés joined Fios Genomics four years ago, transitioning from an academic position, and has since successfully led or supervised dozens of projects for our clients. These include RNA-sequencing, proteomics, metabolomics, and other high-throughput data types, showcasing his expertise in -omics data analyses. To get in touch with Andrés to discuss the information in this article, or to discuss how the team at Fios Genomics could help with quality control and processing of your data, use the form below.
See Also:
Bioinformatics Report Example – Your Data Explained

